Performance Services
Customized Performance EvaluationsPerformance Services
CMS has solutions to help your industry perform
Is your tubular air heater quietly causing you problems and leading to hidden costs? When degradation begins, failure is not a linear process. The failure process can quickly accelerate while the unit is online causing a severe impact to boiler performance.
Corrosion Monitoring Services has developed a suite of tools and services to evaluate the operational performance of your boiler and air preheater systems. While a unit may contain multiple air preheaters of different types such as tubular and Ljungstrom types, our process focuses only on the tubular air heater. This approach allows our tools to work in conjunction with CMS Inspections to evaluate the impacts of current tubular air heater problems and opportunities for improvement based on proposed repairs or replacement.
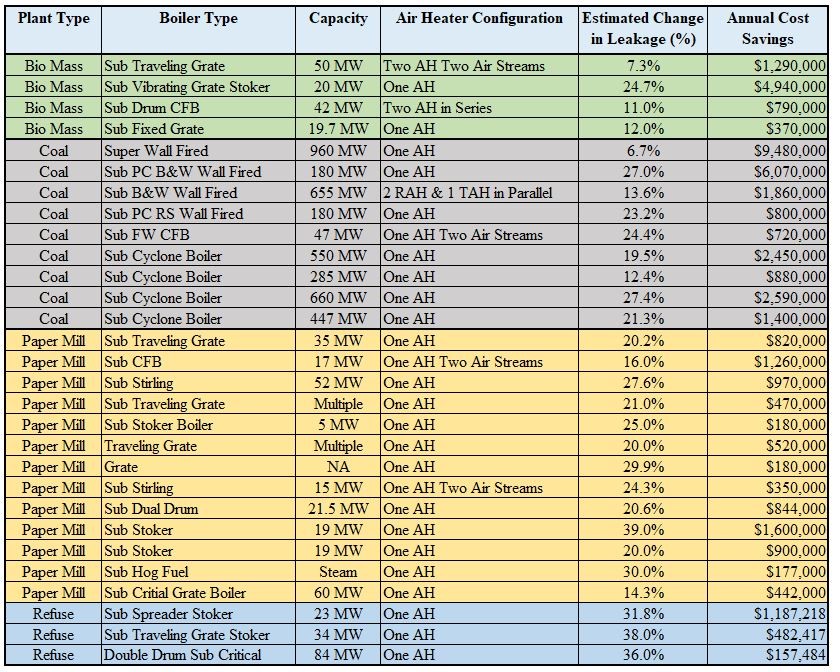 Figure 1 - CMS has worked with multiple industries to evaluate the Financial Impact of Air Heater Performance. The table above shows some sample cases for different capacity boilers / designs, number of air heaters, and variation in TAH leakage.
Customized Performance Evaluations
CMS Performance Services prepares customized performance evaluations to meet the needs of the customer. Our suite of tools can help to justify the cost of repairs, provide technical calculations to support grant proposals, evaluate the impacts of tube configuration changes, or almost any other air preheater performance-related issue.
Cost Savings Study
Cost Savings Studies, the foundation of the CMS Performance Services suite, have been used in many different industries and boiler configurations. This process enables CMS performance engineers to become familiar with your unit and how it interacts with the rest of the facility. Working directly with your personnel, an experienced team uses the following process to uncover the interaction of problems in your tubular air heater and impacts on other equipment in your operation:
The results of the Cost Impact Study are summarized in a Financial Impact Report, which details the operational and repair history of the system as well as the thermodynamic results and the discounted cash flow resulting from repair cost. Samples of these reports and calculations can be provided by CMS Performance Services upon request. Another advantage of this process is that it can be repeated periodically to track unit performance and/or degradation.
The Cost Impact Study is broken into three specific parts:
Operational Process Data Collection and Review
The first step in the Cost Savings Study is to evaluate key process parameters. CMS thermal performance engineers will review the configuration of the boiler system and its interaction with the rest of the plant systems. To accomplish this, we review measurement lists for the historical database, images of operating screens, or PIDs. From this information, a measurement list is developed that looks at key parameters for boiler, air preheater system(s) and overall plant performance. If measurements are not included in the historical database, arrangements can be made to collect manual data to support the overall study.
Once this measurement list is complete, site personnel download approximately two years of data for CMS review. In this process, data is plotted (similar to the plot below) to evaluate changes in operation that are discussed with the site engineers. This enables the project team to determine if the changes are operational choices, damage/repair-related, or instrument errors. With this information, CMS is able to select one or more test cases for Thermodynamic Analysis.
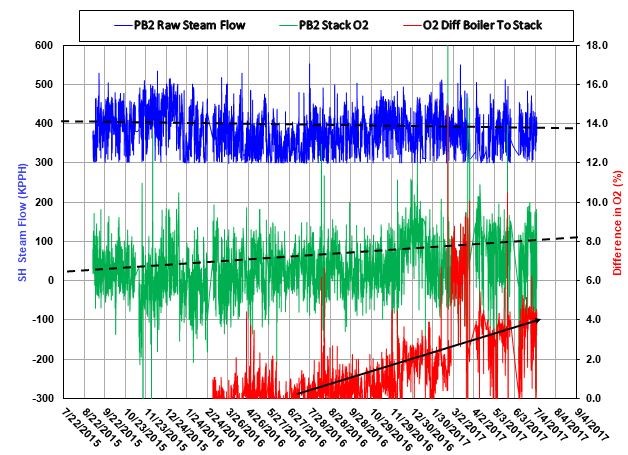 Figure 2 - The plot above shows the basic operational data review process. Two key operational components are plotted for evaluation. In this case, the boiler steam output (blue plot) is compared oxygen (O2) readings before and after the tubular air heater. The plot shows the progression of system leakage (red plot) and boiler excess air (green plot).
Thermodynamic Analysis
The CMS Thermodynamic Calculator is a powerful addition to support the findings for any tubular air heater inspection, maintenance and performance management program. For instance, plant performance data can be analyzed before an air heater inspection to identify and quantify leakage and other performance problems. When CMS personnel perform their visual and other non-destructive inspections, they always supply materials necessary to plug leaking tubes to regain fan capacity and limit performance losses until maintenance can be planned.
The CMS Thermodynamic Calculator focuses on the following:
The CMS Thermodynamic Calculations are based one ASME Performance Test Code (PTC) Methods. Boiler Performance is based on ASME PTC 4.1 and evaluates the boiler efficiency as well as estimating flue gas flow and fuel flow. These calculations are based on measurements from station instruments and provide an excellent basis for a performance-tracking tool. The CMS Thermodynamic Calculator has other added features for boiler performance, such as the ability to blend multiple fuels coming into the boiler. By having an estimate of the fuel constituents, heating value of each fuel, and the firing proportions, a blended approximation of fuel quality is developed. This blended fuel and excess O2 reading at the boiler exit is used in a detailed Stoichiometric analysis of the flue gas. The outputs of this analysis can be used to support the estimate of Acid Dew Point Temperatures for your specific fuel blend.
The second major component of the CMS Thermodynamic Calculator determines Air Heater Leakage and Performance. These calculations are based on ASME PTC 4.3. Like the boiler calculations, the air heater calculations are based on station instrument measurements. In some cases, more detailed measurements may be required than are available in the station instruments. In those cases, manual readings of items, such as flue gas O2 concentrations, may be required at the inlet and exit of the tubular air heater. If multiple TAHs are routed in series, additional O2 readings may be required to separate the performance of the individual air preheaters. Once again this is based on owner requirements and installed instrumentation and is evaluated for each individual client.
The final portion of the Thermodynamic Calculator is a heat rate study. This places the tubular air heater leakage in context of the overall system. By evaluating the overall power output (if applicable), and the boiler heat input, a general idea of the heat rate is determined. To further focus the heat rate estimation on the tubular air heater impact specific auxiliary loads are evaluated, such as fan power used to move air into the boiler and flue gas out of the boiler. Additionally, power consumption of emissions equipment downstream of the air heater, such as electrostatic precipitators, are also included. Finally, estimations are made for steam-driven auxiliaries that are converted to equivalent power to provide a better indication of boiler limitations. Once the auxiliary loads are determined, they are subtracted from the gross power output and the net heat rate is determined.
With the completion of the Thermodynamic Analysis, the results are then used to estimate Economic Impacts.
Economic Impacts
Since the air preheater is so crucial to overall system performance, it is necessary to accurately determine the financial impacts of all relevant operating constraints. It is also necessary to isolate the effects of different repair and remediation approaches, so that a true incremental cost analysis can be estimated. This tool enables planners to have an objective, reliable, and defensible basis for evaluating maintenance budget requests and making expenditure decisions about an increasingly important asset. The CMS Thermoeconomic Calculator combines detailed thermodynamic performance calculations with real-world impacts to operational costs.
CMS evaluates the following parameters:
Air Heater Leakage directly impacts the auxiliary loads through several paths. First, forced draft (FD) fans push air into and through the air preheater. As air preheaters begin to leak, more air has to be forced through the unit to meet the combustion air needs, thus increasing the fan load. Along the same line, air preheater leakage increases the flue gas flow, while also decreasing the temperature and increasing the gas density. This increases the load on induced draft (ID) fans. Additionally, certain emissions control devices are negatively impacted by the increased flow. These increased loads either increase power consumption or reduce available power for sale.
Air Heater Leakage directly impacts the boiler efficiency and thus the amount of fuel needed to maintain steam production. Another source of fuel cost savings comes in evaluating the Aux Load. In most cases, the Aux Load is taken off of the power generation. In those cases, in order to maintain the Net Generation target, additional fuel is consumed to provide the increased Aux Load. As such, fuel consumption is a major financial impact.
Increases in fuel consumption have another financial impact. As the fuel consumption increases, so does the ash generation (assuming the fuel contains ash). Additionally, this increases consumption of emission control chemicals, such as lime, ammonia, and other chemicals. Additionally, some emission control devices wear faster with increased loads, such as Selective Catalytic Reduction (SCR) devices and bag houses. CMS strives to determine what chemicals are used and the quantities consumed. Totals of these cost factors are normalized to power generation. These normalized cost factors are then multiplied by change in net power generation to determine the economic impact.
Steam generation is the ultimate product for a boiler system. Steam generation can have economic impacts in potentially two different ways. First, reduced steam generation leads to reduced power generation. Secondly, in some cases such as co-generation and paper mills, the steam itself is a valued export. The CMS Thermoeconomic Calculator is able to capture these variations and provide estimations of the financial impacts.
In select cases, with client input, the effects of power deratings can be included. This requires close collaboration with the client, since the derating has to be tied to boiler operation and not seasonal performance of the steam turbine generator (STG).
Discounted Cash Flow Analysis
Once all of the above cost centers have been evaluated, the sum of the applied factors is used to perform a Discounted Cash Flow Analysis.
The Discounted Cash Flow Analysis evaluates the cost savings on an annual basis against the estimated repair costs to determine:
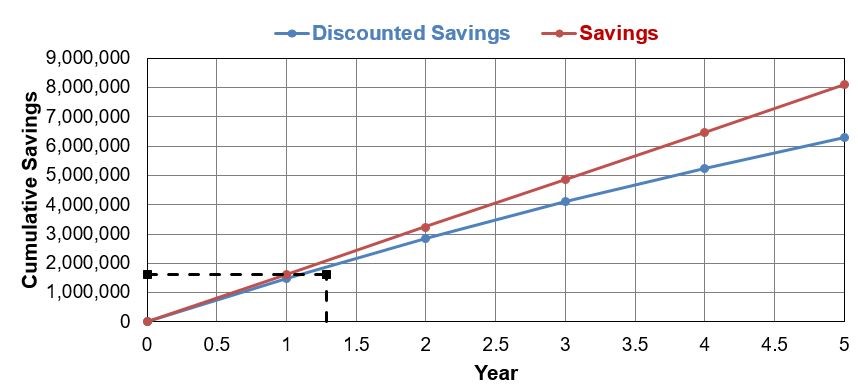 Figure 3 - The savings are projected in both standard and discounted formats, along with the repair cost, to provide a quick pictorial representation of the savings over the selected time period. The chart above represents a recent study.
Emission Reduction Study
Since most plant emissions are restricted, variations in unit performance have a direct impact on the stack emissions. In most cases, this reduction comes in the form of boiler efficiency improvements (determined in the Thermodynamic Analysis) that reduce fuel consumption. In some cases, small changes in the fuel blend can also reduce the emissions. CMS has developed an Emissions Variation Estimator that can be added into our Thermoeconomic Calculator. For this reason, the Emission Reduction Study can only be performed in conjunction with Cost Savings Study.
There are a variety of reasons a facility may want to have this study performed:
Calculations Methodology
In order to understand the impacts, CMS Performance Services Engineers evaluate the following specific emissions:
This analysis is based on a wider system view than just the boiler and air preheater. CMS Engineers will require additional input from the client on the emissions control costs and performance. The advantage of this process is that CMS can provide an estimate of financial value in potential savings from these reductions. As part of the Thermoeconomic Calculator, the consumables costs are monetized and normalized to power generation. Additionally, if other costs are identified related to emissions, these can be included in the calculations.
Boiler efficiency improvements reduce fuel consumption. As this occurs, the emissions vary directly with fuel rate. Since this is the primary goal of the Cost Savings Study, the first emission reduction comes from reduction of air in leakage by tubular air heater repair or other leakage sources, such as holes in expansion joints or ducts.
In some cases, emissions can be further reduced based on changing the composition of fuel consumed in the unit. For a unit with multiple fuels, changing the burn proportions varies the fuel blend and thus the emission profile. Another change that has been used for coal units is to replace the coal with a type containing less sulfur, thus reducing part of the emissions. These changes in the fuel blend may have other contractual implications that have to be carefully navigated with the client. For instance, the cost of the fuel will change based on the blend or source of fuel selected.
In other cases, the facility may have contracts in place for the purchase of fuel that limits the variation. There may also be storage volume limitations. Other fuels, such as natural gas, may have seasonal limitations. All of these factors need to be considered. Many of these issues require close interaction between the client and CMS, which helps us develop the best solution to meet your unit’s needs.
It is well known that combustion of many types of fuel produce chemical compounds that, when mixed with moisture in the flue gas, create acids. These acids become an issue when the metal surface temperatures drop below the acid dew point and condense out of the gas. In those cases, the acid attacks the surface and begins the process of acid dew point corrosion. This damage mechanism, shown in the photo here, is commonly observed during CMS Inspections. Based on our experience with inspection and repair of this type of damage, a variety of unique CMS Solutions have been developed to counteract this particular damage mechanism. Operators are sometimes surprised by the level of damage found by the inspection, even though they have been operating within established guidelines.
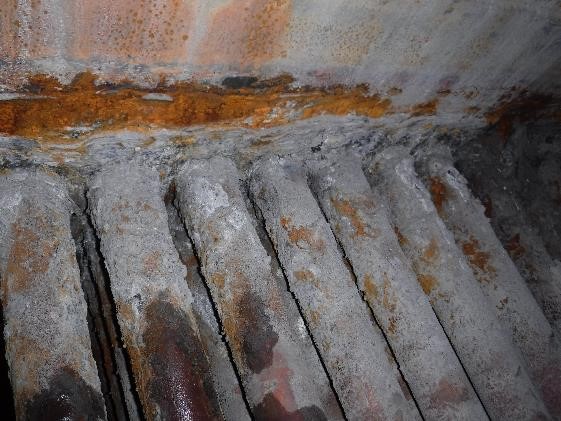 Figure 4 - Acid dew point corrosion in its early stages is a common finding on the cold end combustion gas outlet tubes. In figure above, combustion gas flows around the outside of the tubes, and the tube sheet area nearest the cold air inlet has been operating wet and already collected liquid and ash.
Building on its experience with thousands of inspections, CMS developed an Acid Dew Point Estimator (ADPE) based on specific flue gas chemical compounds. There are several industry time-proven standard methods used to calculate acid dew point of the acids found in fossil fuel combustion gas. Generally, these calculations are focused on each specific type of acid in the gas. The ADPE is designed to work in conjunction with the Thermodynamic Calculator in a Cost Savings Study. As an addition to the Cost Savings Study, the ADPE can use the Stoichiometric analysis, based on a blended fuel that matches the unit under study. Along with these results, other measurements are required, such as the tubular air heater exit gas pressure and temperature. Ideally, an indication of the tube metal temperature at the air heater outlet greatly improves the results. If these measurements are not available, CMS can design and install a thermocouple application to obtain these values.
Acid Dew Point Estimator
There are a wide variety of equations that have been defined to calculate acid dew points. All of these are based on the chemical interaction between water and other flue gas chemicals (listed in Figure 5) to produce an acid.
In the case of the ADPE, three flue gases are evaluated:
In order to determine the key chemical proportions in the flue gas, a stoichiometric analysis is performed based on a blended fuel in the Thermoeconomic Calculator. The SO3 proportion is either calculated based on a referenced equation or estimated to be somewhere between 1% and 5% of the SO2 input based on industry studies. Understanding the SO3 conversion rate, the SO2 and SO3 portions are defined based on the boiler stoichiometric SO2 emissions entering the TAH.
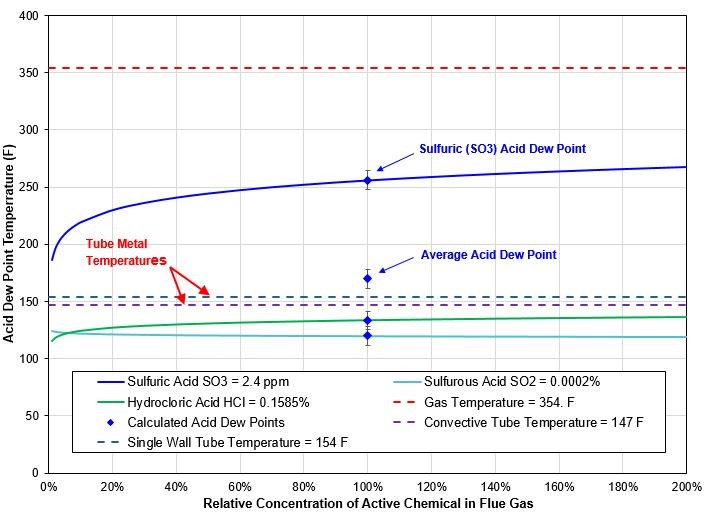 Figure 5 - The flue gas temperature is near the sulfuric acid dew point curve, indicating that acid formation is possible. The surface temperatures of the tubes in some areas are likely below the acid dew point. Tubular air heater inspections commonly identify that the acid dew point corrosion occurs in the first few rows of the tubular air heater near the cold air inlet. As the tubes are removed from service by corrosion failures, ash plugging, or mechanical plugging, the corrosion process moves further into the tubular air heater.
Hydrochloric acid is assumed to be one minus the sum of the other parameters if chlorine is known to be included in the fuel. This emphasizes the requirement for fuel analysis data to determine the dew point and concentrations of acids. The ADPE can be applied to determine the real acid dew point for the fuel blend being burned. These values can be used to evaluate the unit exit gas profile and the tube metal temperature required to prevent acid corrosion.
Based on the chemical proportions determined above, the tubular air heater exit gas pressure and temperature the primary acid dew points can be estimated. The value for each component is varied from 0 to 200% of the original value to determine the variation in the dew point temperature. An example is provided below based on a 1% SO3 conversion rate from SO2.
As Figure 5 shows, the primary driver of the corrosion is usually sulfuric acid. Considering that one of the primary drivers of the acid dew point temperature is the moisture in the flue gas, it is important to see how variation in moisture affects the acid dew point temperature.
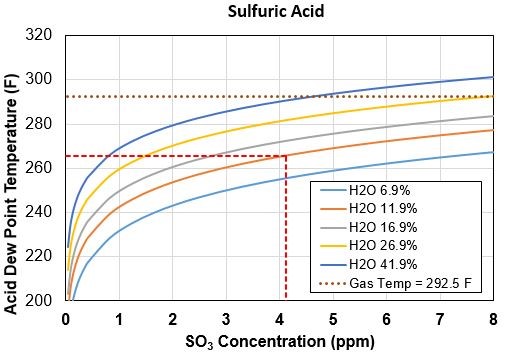 Figure 6 - The variation of sulfuric acid dew point for variations in SO3 and moisture.
As can be seen in Figure 6, increases in moisture content drive the acid dew point upward. Moisture in the flue gas has the widest variation with time. These variations are based on changes in both fuel, and combustion air. Moisture content around 20% in the exit gas is not uncommon in biomass combustion processes. The determination of the potential for acid dew point corrosion is not a simple matter. There are a wide variety of inputs, some of which the operator has no control or knowledge that they are occurring. Additionally, operational control is often based on average gas temperature, not tube metal temperatures.
Figure 6 also demonstrates that the tube surface temperature is critical in reducing Acid Dew Point Corrosion. In many cases, this parameter is not measured and tracked. In many operations, the air heater exit gas temperature is used to manage this damage mechanism. Most systems use an array of multiple temperature sensors in this region. However, the control often displays only an average value. While this is appropriate for performance calculations, variations in the individual temperature sensors may indicate potential cold regions in the exit where acids may form. Figure 7 shows a unit in which the exit gas temperature varies between four different sensors. A plot of the steam generation is provided to indicate the operational load of the unit to be able to separate operational variations from performance variations. The approximate average exit gas temperature is shown with the dashed black lines that follow the curves.
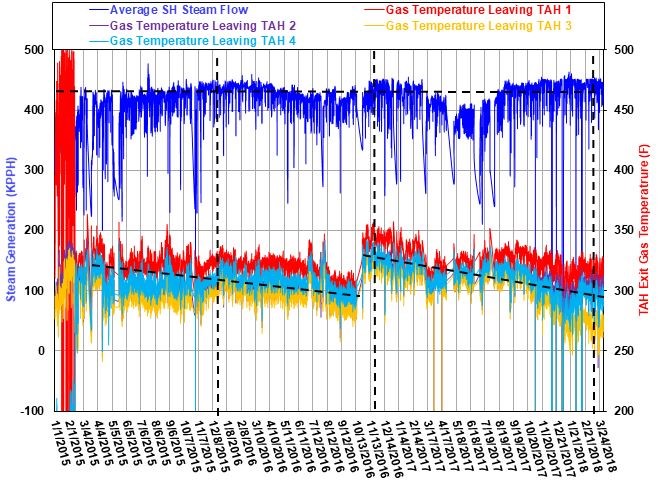 Figure 7 - Exit gas temperature variations.
Tube Side Pressure Drop
Corrosion Monitoring Services has developed a proprietary Tube Side Pressure Drop Calculator based on a complete Cost Savings Study and Inspection. This tool should be used when CMS or the customer evaluates changing a tube configuration, either to increase surface area or when Convective Tubes for corrosion control are recommended. The information obtained via this calculator is useful in determining the impact on boiler and fan operation.
This tool uses the output from a Thermodynamic Analysis as well information collected for the Operational Process Data Review to estimate the pressure drop through the new tube configuration. For this process, the CMS Performance Services engineers work closely with the CMS Solution experts to develop a repair plan that best benefits the client.
Example 1
A client has several rows of tubes that are widely spaced, and they want to increase the overall heat transfer of the air heater. One solution might be to add more tubes of the same size and reduce the spacing between the rows. In that case, the area inside the tubes would increase and thus decrease the tube side pressure drop. However, in this example, the spacing of the tubes changed so the Duct Side Pressure Drop will be effected as well. A second option might be to change the diameter of the tubes used and thus be able to increase number of tubes in the area. This has possible process repercussions to heat transfer as well as fan operation in both the tube and duct side pressure drop.
Example 2
A client has an air heater that is suffering from Acid Dew Point corrosion in first five rows of the air heater. If the goal is to increase reliability and decrease repair costs, Convective Tubes may be applied. In that case, the outer surface will remain the same, but the inner diameter is reduced for a portion of the tube length. In that case, the Tube Side Pressure Drop Calculator would be applied to see if the increase in pressure drop will exceed the limits of the fan driving the flow in the tube.
Duct Side Pressure Drop
Corrosion Monitoring Services has developed a proprietary Duct Side Pressure Drop Calculator (designed to be an optional scope item) based on a complete Cost Savings Study and Inspection. It should be used when CMS or a client recommends changing a tube configuration to modify surface area. This information is useful in determining the impact on fan operation.
Example 1
A client has several rows of tubes that are widely spaced and wants to increase the overall heat transfer of the air heater. One solution might be to add more tubes of the same size and reduce the spacing between the rows. In that case, the area inside the tubes would increase and thus decrease the Tube Side Pressure Drop. However, in this example, the spacing of the tubes changes, so the Duct Side Pressure Drop will be effected as well. A second option might be to change the diameter of the tubes used and, thus, be able to increase number of tubes in the area. This has possible process repercussions to heat transfer as well as fan operation.
Air Heater to Stack Leakage Study
Boiler-to-Stack Leakage Studies are useful in cases where the client is limited on fan capacity, but the air heater inspection may not show potential for high leakage. Ideally, this study would be added to a Cost Savings Study, so that the leakage could be financially quantified. The performance of this study may require O2 readings to evaluate the leakage level around different component in the flue gas train. All air in leakage impacts the performance of the induced draft fan(s), which is a significant portion of the boiler aux loads. A CMS Performance Services engineer would work with the client to determine the measurement requirements and testing plan. The testing plan may be executed either by plant staff or CMS depending on the client’s needs.
Example 1
CMS completes an inspection of an air heater and finds limited damage in the heater that would create leakage. The unit operator states that at certain times of the year, they have to reduce load because they don’t have enough ID fan capacity. At first, this is perplexing since the operator may not have sufficient data to identify what has changed in the system that is causing the limitation. The first place to look for excess flow is air heater leakage. Since that shows limited indication of leakage, something else must be the cause. By evaluating the system layout, CMS can recommend other equipment to inspect, or collection of O2 and temperature readings along the flue gas path may provide an indication of other sources of air in leakage.
Example 2
A client has two similar units in operation, but one unit has a lower flow at the stack then the other. In order to sort out this difference, the air heaters are inspected. By performing a Cost Savings Study in conjunction with an Air Heater-to-Stack Leakage Study, CMS may be able to identify operational differences, maintenance differences, and even fuel differences that influence the overall flow difference seen at the stack.
Contact CMS Performance Services and Turn Your Data into Power
CMS Performance Services studies give you the information that you need to make important maintenance and capital expenditure decisions. It is important to look at both the details from inspection reports and the big picture to make choices that help improve equipment efficiency and avoid costly damage, everything from air preheater tube failures and expansion joint damage to air duct corrosion. Contact CMS at (800) 637 6592 and schedule a call to discuss next steps in providing you with powerful information that saves you time, money, and headaches.